Ecological Footprint of Developed Countries
by Ellen Hsu, Alexis Sophie Kozak and Samita Limbu
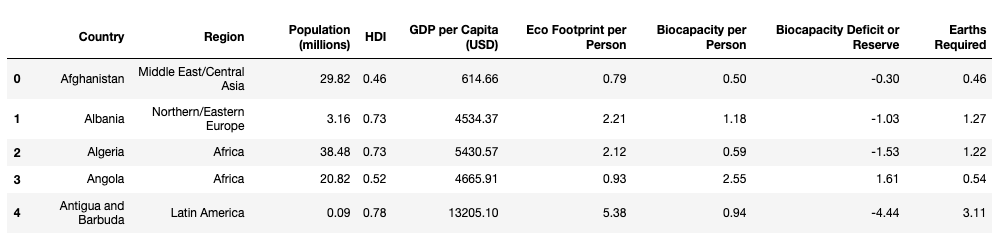
Our team analyzed the overall impact of population, HDI (development of a country), and GDP on the ecological footprint per region in a global data set. We also compared different land uses to see which ones were creating a greater proportion of biodeficit or reserve.
A. Population
1. Do countries with a higher population demand more resources in terms of Earths required per person?
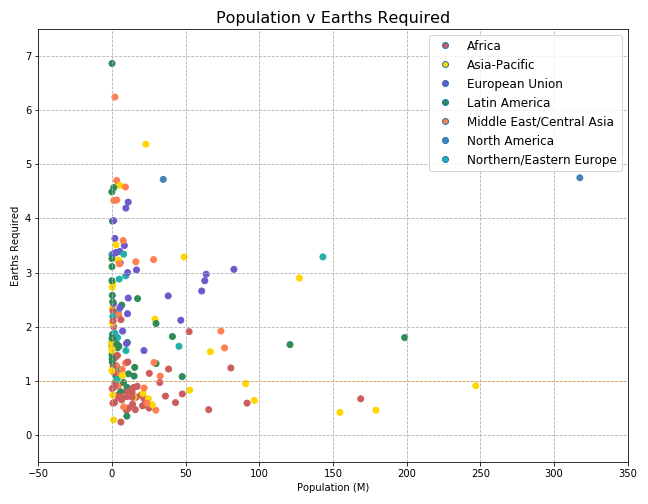
- There does not seem to be a definite relationship between Population and Earths Required. There is mainly a cluster of low population countries distributed randomly along the Earths Required axis.
- However, most countries regardless of population are still Earths Required > 1.0.
(Two countries with outlier populations (> 350M), China and India, were not included on this graph. Their Earths Required are 1.95 and 0.67, respectively.)
B. Developed Countries (as defined by HDI vs. GDP)
2. Since population doesnt seem to effect Earth's required, does the overall development of a country (HDI, GDP per Capita) effect Earth's required?
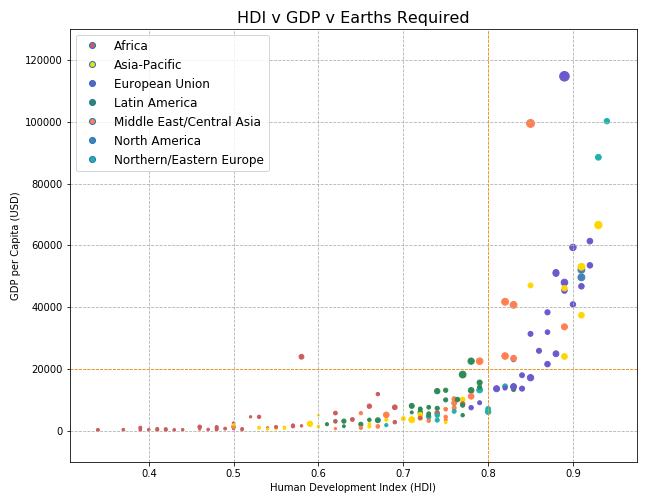
- HDI and GDP, in part, define the development of a country. HDI is the quality of a basic standard of living. GDP is the output of produced goods and services.
- Developed countries are considered those with HDI >= 0.8. The range(s) for GDP of developed countries is not fully agreed upon by economists but generally hover around $20,000.
- As you can see, the countries begin to change around these limits. Earths Required gradually become greater as countries become more developed.
C. Development of Countries: HDI
3. Taking a closer look, do countries with a Higher HDI score have a greater Earth's Required per person?
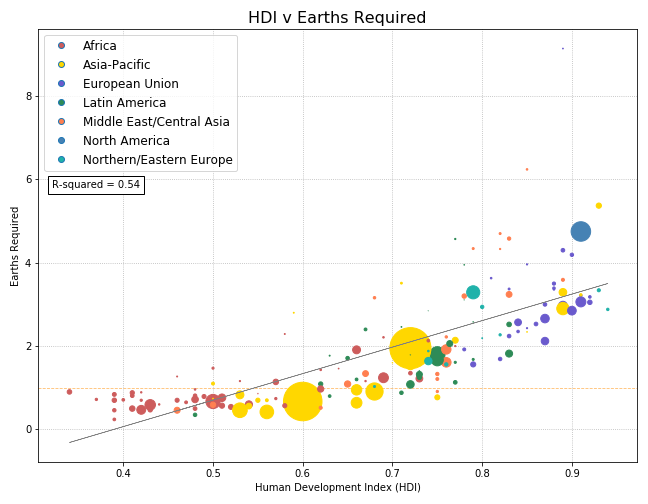
We explored the relationship between HDI and Earths Required. The datapoints in the scatterplot represent countries. Colors represent different region and the size of the datapoint represents size of the population.
The figure shows that there is a gradual increase in Earths Required as the HDI increases. We used a linear regression model used to fit the relationship with R-squared value of 0.54
Region may have some impact on the Earths Required. However, the pattern is not as clear from the figure.
Population did not seem to impact Earths Required
4. Breaking the HDI down into groups, which HDI groups have a higher Ecological Footprint per person?
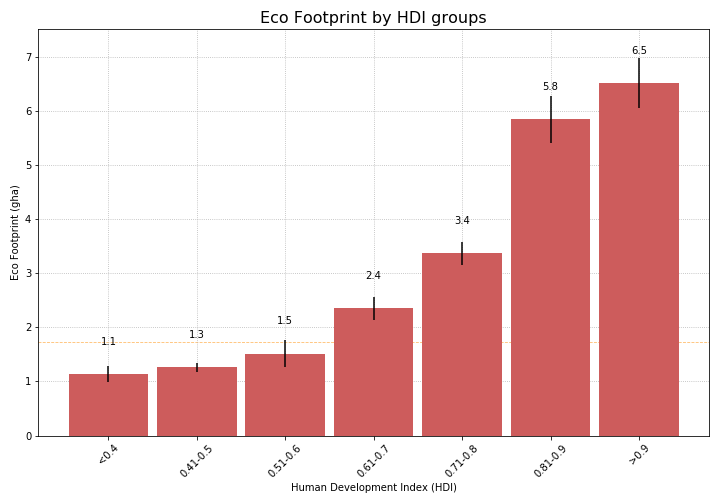
- The Bargraph shows that, countries with higher HDI score have greater Earths Required.
- The figure also indicates that there is a significant difference in ecological footprint between HDI categories
5. Hypothesis Testing:
Hypothesis
Developed countries have a higher ecological footprint. If the HDI group consist of score >0.6 Then, the ecological footprint would be larger compared to groups with HDI score < 0.6.
Null
If level of development in a country has no effect on ecological footprint, then the ecological footprint would be random across countries.
Results
There was significant difference in the Total Eco Footprints among HDI groups (p-value 2.65e-29). This means the development of countries does have an impact on footprint.
The Independent T-Tests between HDI groups shows there was significant difference in the Total Eco Footprint in the range of HDI > 0.5 to HDI <= 0.8.
6. Is there a relationship between HDI vs. Biodeficit or Reserve?
Deficit/Reserve = $Average Biocapacity - Average Ecological Footprint$
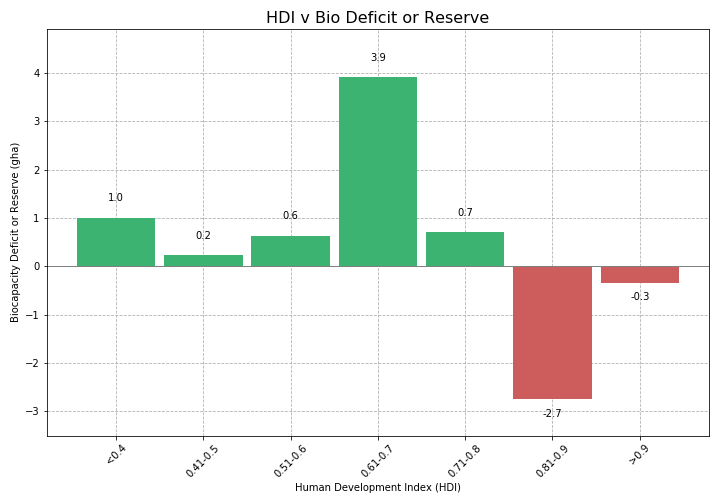
- The figure shows that there is a biocapacity deficit among countries with higher HDI score, though not in a linear fashion.
D. Development of Countries: GDP
7. Is there a relationship between HDI vs. Biodeficit or Reserve?
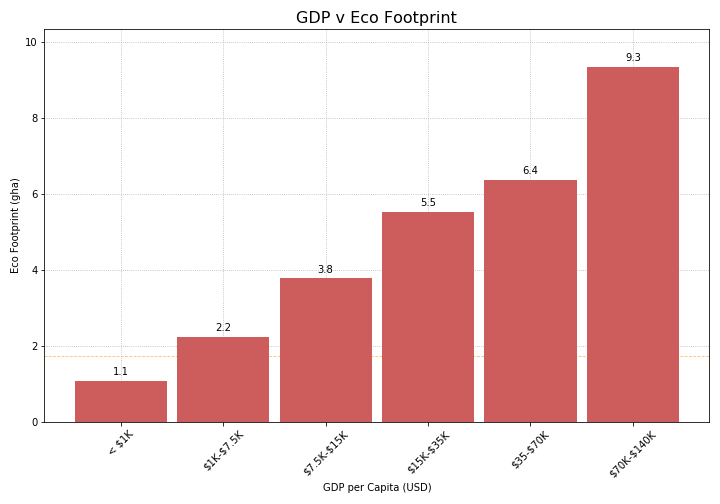
- Viewing this graph, it is clear that the higher the GDP per Capita, the higher the Ecological Footprint.
- Bins were broken down according to references in World Bank and UN Documents. Large disparities in GDP per Capita exist due to large disparities in wealth between countries.
8. Which GDP groups display a Deficit or Reserve? Is there a relationship?
Deficit/Reserve = $Average Biocapacity - Average Ecological Footprint$
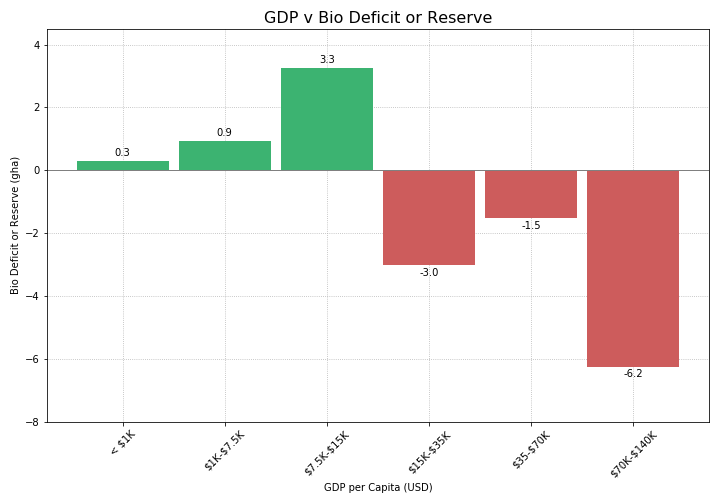
- What is almost clear, is that Countries that are considered "developed" typically fall into a deficit. But our 5th group, somehow, slightly less of a deficit than the surrounding groups. Further study among these groups may be required.
- It is worth mentioning that a slight different arrangement of bins can yield very different results in Bio Deficit or Reserve. Thus there is not a clear relationship between GDP and Bio Deficit or Reserve.
E. Land Use
9. Of all the land types, which are creating a reserve? Which are creating a deficit?
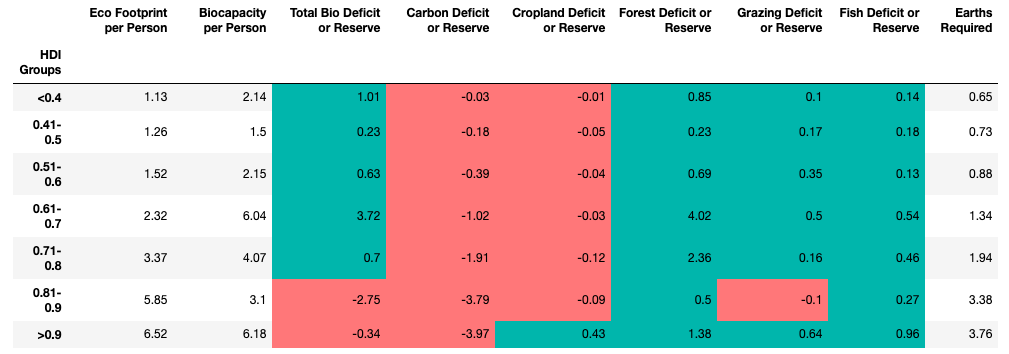
- All groups have a Carbon Deficit which shows that Urban Land is where most ecological assets are being consumed rather than produced.
- Eco Footprint and Carbon Deficit are rather high around HDI groups 0.7 and 0.8 where countries are reaching a "developed" stage.
10. Which land types are making the largest contributions to the overall footprint?
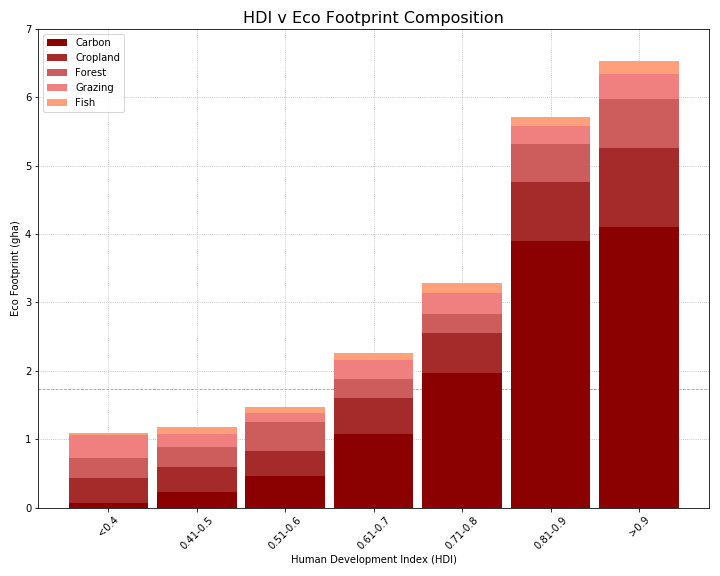
- Most groups have a large Carbon Footprint. Carbon Footprint primarily comes from Urban Land. Urban Land consumes a lot resources and produces a lot of waste while other Land Types produce a lot of resources while producing little waste, even absorbing some waste.
- The HDI groups of fully developed countries have dramatically higher eco footprints.
F. Conclusion
As many of you have guessed, it is the more developed countries that are overusing their resources, growing, building, creating more and more of a demand on Earth’s stretched resources.
It is not just a problem in the U.S., it is a problem across the world. It is with the lense of the Human Development Index and GDP per Capita - the defined measures of country development and wealth - that we see an influence on the world's ecological reserves.
Factoids
- The U.S. ranks 184 out of 188 countries in size of Ecological Footprint per person.
- There are 45 developed countries globally. All of them have Earths Required > 1.0 which means all of them are using more than their share of biocapacity.
- There are 143 countries (76%) that are still considered “less-developed”.
51 of them are “developing” (HDI between 0.7 & 0.8) and potentially will reach “developed” stage soon. - There are 129 countries globally (69%) that have Earths Required > 1.0.
Further Research
- As mentioned, the results of bio deficit/reserve varied wildy. Further research might reveal which specific countries are causing higher bio deficits or reserves and what they have in common.
- The available data set was for one year only. It would be worth researching the changes in ecological footprint and bio deficit/reserve over a span of several years or decades.